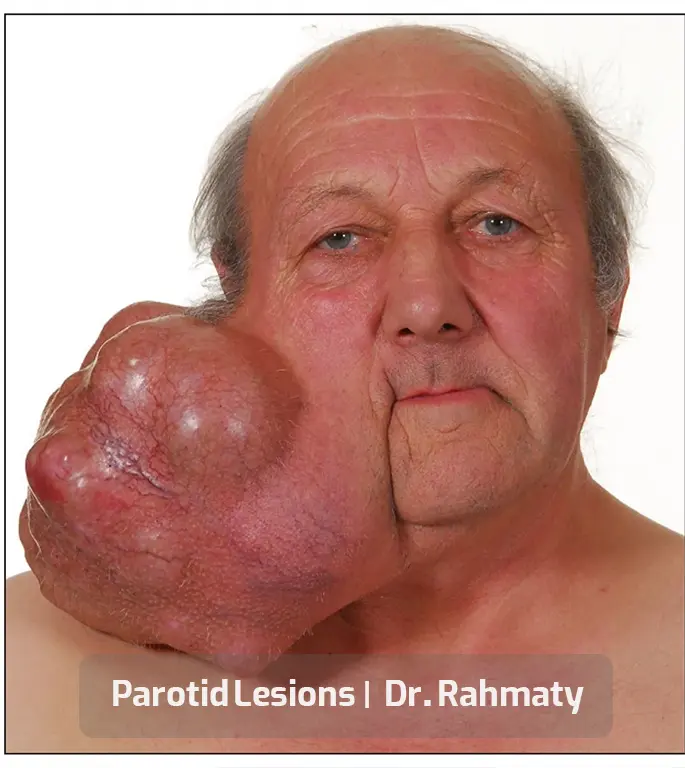
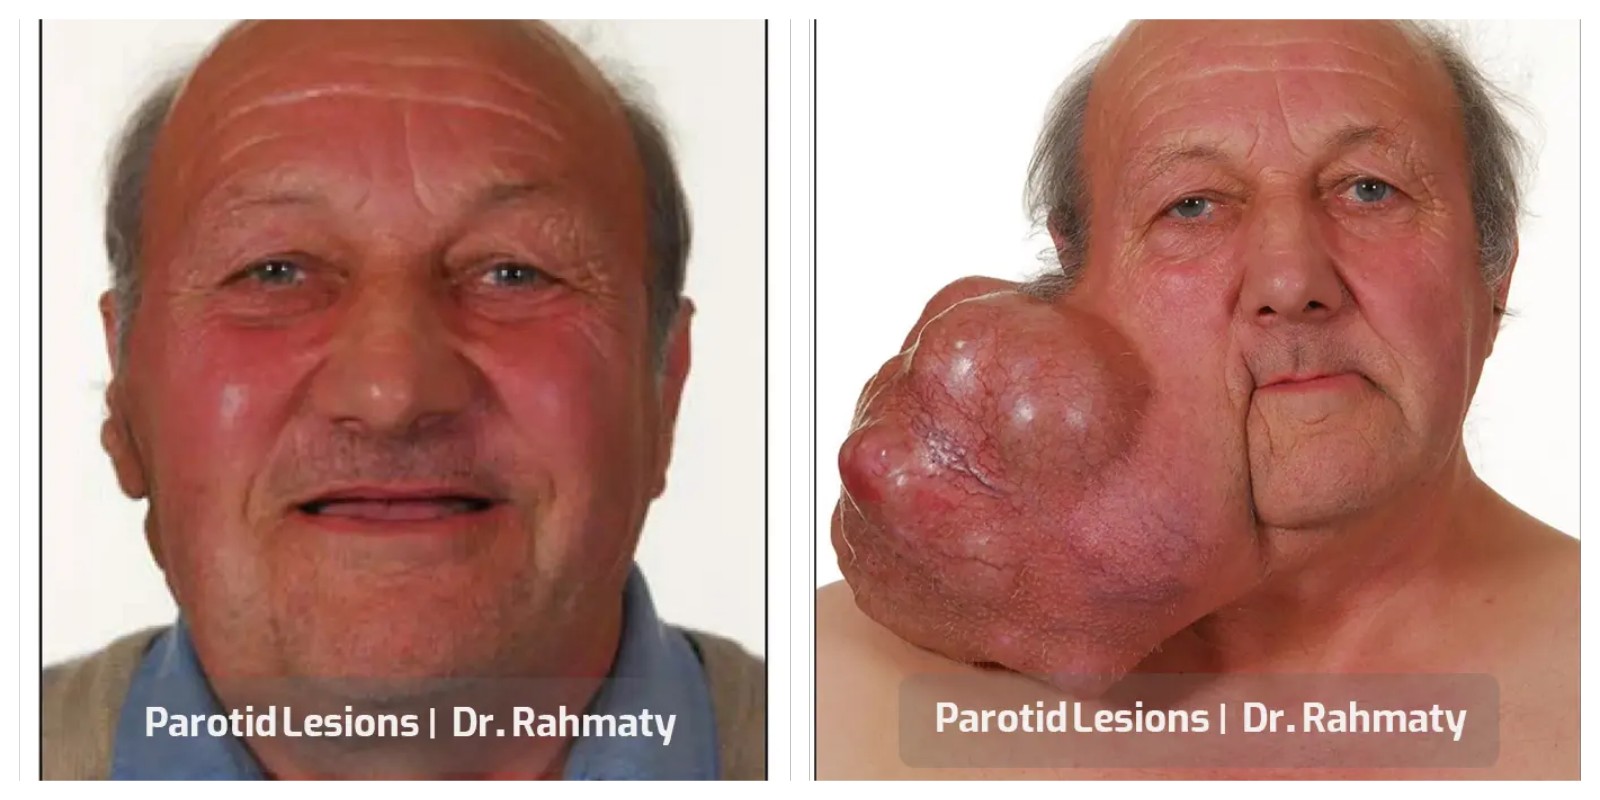
Perfusion Computed Tomography Imaging in Differentiating Benign from Malignant Parotid Lesions
The most common site for salivary gland tumors is the parotid gland. Imaging modalities such as computed tomography (CT), magnetic resonance imaging (MRI), and ultrasonography are commonly employed to differentiate benign from malignant parotid tumors.
The aim of this study was to evaluate the diagnostic value of CT perfusion imaging in differentiating the histological classification of benign and malignant parotid tumors.
Methods:
A total of 29 patients with parotid neoplasms were enrolled in this study. The patients’ ages and all CT perfusion parameters (including gradient and permeability, blood flow [BF], blood volume [BV], mean transit time [MTT], permeability surface [PS], maximum intensity projection [MIP], time-density curve [TDC], and time to peak [TTP]) were compared among three groups: malignant tumors (MTs), Warthin tumors (WTs), and pleomorphic adenomas (PAs).
Results:
The mean age of the patients was 55.9 ± 14.1 years (range: 26–77 years), with 15 male patients (51.7%). Eleven lesions were PAs (37.9%), eight lesions were WTs (27.6%), and ten lesions were MTs (34.5%) (including six acinic cell carcinomas [ACCs], three adenoid cystic carcinomas [AdCCs], and one mucoepidermoid carcinoma [MEC]).
The mean age for patients with WTs was 62 ± 7.5 years, 52 ± 14.2 years for those with PAs, and 55.2 ± 17.2 years for those with MTs (p = 0.32).
The mean MIP value for WTs was 122.7 ± 12.2, while it was 80.5 ± 19.5 for PAs and 76.2 ± 27.1 for MTs (p < 0.001). The mean MIP in WTs was significantly higher than that in PAs and MTs; however, the difference between MTs and PAs was not statistically significant.
The mean values for BF, BV, and the peak of the time-density curve were higher in WTs compared to the other two groups. In addition, the TDC peak time and TTP were higher in PAs compared to MTs.
Conclusion:
Based on this study, CT perfusion imaging of the parotid gland and its parameters can effectively differentiate benign from malignant parotid masses.
Introduction:
Salivary gland neoplasms are relatively rare, accounting for 2% to 6.5% of all head and neck tumors. Malignant lesions typically present after the age of 60, whereas benign lesions often appear in patients over 40 years old. Benign neoplasms are more prevalent among women, while malignant tumors occur equally in both sexes.
The most common benign parotid neoplasm is pleomorphic adenoma (PA), accounting for approximately 60% of all parotid tumors. Warthin tumor (WT) is the second most common benign tumor, with an incidence of 15–20% of all parotid tumors. Malignant parotid tumors (MTs) are rare, with an incidence of 2–3 cases per 100,000 population.
According to the literature, 20–30% of parotid tumors, 40% of submandibular tumors, 50% of minor salivary gland tumors, and 90% of sublingual gland tumors are malignant. The most common malignant parotid tumor is mucoepidermoid carcinoma, followed by adenoid cystic carcinoma, squamous cell carcinoma, and adenocarcinoma.
Imaging modalities provide critical information about the location (extracapsular or intracapsular), superficial and deep lobe involvement, facial nerve and adjacent structure relationships, tumor extension, neural involvement, and nodal metastasis. CT and MRI are routinely used for the evaluation of head and neck tumors.
Generally, benign tumors are more homogeneous with well-defined margins, while malignant lesions often present with ill-defined margins and heterogeneous appearance. Biopsy of suspicious lesions is an essential step to confirm the diagnosis.
Perfusion CT has recently been introduced as a novel method to visualize neovascularization, which is a hallmark of malignancy.

Malignant tumor characteristics, which enable rapid growth, facilitate functional assessment through perfusion CT by evaluating parameters in salivary gland neoplasms, such as tissue perfusion. Additionally, it can gather morphological information that conventional CT scans cannot provide. Perfusion CT measures microvascular density and vascular permeability using various parameters: blood flow (BF), which measures the volume of blood passing through the tissue during the first pass; mean transit time (MTT), corresponding to the average time (in seconds) required for red blood cells to traverse a specified volume of capillary circulation; blood volume (BV), indicating the volume of blood within the target tissue; tissue permeability; and, finally, curve model parameters based on time-density relationships, including time to peak (TTP) and washout rate (WR).
In head and neck tumors, perfusion CT findings are based on standard contrast enhancement patterns in helical scans, which are utilized for morphologic and oncologic characterization. Perfusion CT can distinguish between necrotic and viable tissues within large tumors and can visualize reactive or metastatic lymph nodes based on the tumor’s primary perfusion pattern. Using perfusion CT for parotid lesion diagnosis and differentiation helps surgeons choose the optimal surgical approach.

Methods
In this cross-sectional study, 35 patients presenting to our hospital with unknown solid parotid masses, who were candidates for parotidectomy or lesion biopsy, were prospectively enrolled after signing informed consent forms. The study design was approved by the Ethics Committee. Inclusion criteria considered patients without contraindications to contrast agent administration, and there were no age or gender restrictions. The sample size was calculated statistically and included 35 patients, either inpatients or outpatients.
Exclusion criteria were: patients with a definitive pathology diagnosis from previous surgery or biopsy; patients unwilling to undergo biopsy or CT scan; and cases where technical errors prevented accurate perfusion parameter calculation. All patients first underwent non-contrast CT scans evaluated by an experienced radiologist. The injection volume for perfusion CT was determined based on the widest area of the tumor identified on the initial scan.
A total of 60 mL of non-ionic contrast material was injected at a rate of 4–6 mL/s using an injector, under radiologist supervision, for the perfusion CT. Scanning commenced 5–6 seconds after the start of contrast injection, using a 16-slice multidetector CT scanner, followed by a 20 mL saline flush at the same injection rate. After the perfusion phase, a conventional cephalocervical CT scan was performed (notably, the perfusion phase is acquired during the early injection phase and added as additional sequences in this type of CT imaging).
No allergic reactions were recorded, and radiation doses remained within standard limits. For each patient, blood volume (BV), blood flow (BF), capillary permeability (CP), and TTP were calculated based on the CT scans, along with time-density curve (TDC) analyses using Siemens standard software. TTP and WR parameters were used to classify TDCs into four types:
Type 1: Steadily increasing slope without plateau within 60 seconds, TTP < 30 seconds.
Type 2: WR > 30% and TTP < 30 seconds.
Type 3: TTP = 30 seconds and WR < 30%.
Type 4: No plateau phase reached, with TTP > 30 seconds.
A region of interest (ROI) (3–5 mm²) within the most enhanced and relatively homogeneous area of the tumor was selected for perfusion parameter measurement. In heterogeneous tumors, the area with the greatest perfusion advancement was chosen for evaluation.
The external carotid artery served as the reference standard for perfusion parameter measurements. Separate arterial and tumor time-density curves were plotted. Tumor BV, BF, and permeability rates relative to the external carotid artery were calculated using the software, and standard deviations (SD) were separately determined for each parameter.
In cases where technical errors prevented accurate CT perfusion results, patients were excluded. One patient was removed from the study due to technical errors and motion artifacts.
Patients were followed shortly after CT scanning and underwent biopsy or surgery. Pathology results were collected and monitored. Five patients were excluded from the study as they opted for surgery elsewhere.
Ultimately, patients were classified based on histopathology into benign or malignant tumor groups. Further subgrouping was performed based on vascularization:
Hypovascular benign tumors (including pleomorphic adenoma [PA]),
Hypervascular benign tumors (including Warthin’s tumor [WT]),
Malignant tumors (including mucoepidermoid carcinoma [MEC], acinic cell carcinoma [ACC], and adenoid cystic carcinoma [AdCC]).

Statistical Analysis
All analyses were performed using SPSS statistical software version 22 (SPSS Inc., Chicago, IL, USA). Frequencies and dispersion indices were calculated. A p-value of less than 0.05 was considered statistically significant. The normality of data distribution was assessed using the Shapiro-Wilk test, and non-parametric tests were used for non-normally distributed data.
Sample Size
To evaluate the diagnostic accuracy of CT perfusion in differentiating benign and malignant parotid gland tumors (with an expected accuracy of 90% based on similar studies), the sample size was calculated as 35 patients with 80% power and a 5% standard error, using the following formula:
N=(z1−α/2)2×p×(1−p)d2N = \frac{{(z_{1-\alpha/2})^2 \times p \times (1-p)}}{d^2}
A total of 35 patients with parotid tumors of unknown diagnosis and pathology were enrolled in the study between 2017 and 2018.
Results
Ultimately, 29 patients (15 males and 14 females) were included in the study. The mean age of the patients was 55.9 ± 14.1 years, ranging from 26 to 77 years. Lesions were located on the left side in 48.3% and on the right side in 51.7% of cases. Histopathology results included 11 cases of pleomorphic adenoma (PA) (37.9%), 8 cases of Warthin tumor (WT) (27.6%), and 10 cases of malignant tumors (34.5%), including 6 cases of acinic cell carcinoma (ACC) (20.7%), 3 cases of adenoid cystic carcinoma (AdCC) (10.3%), and 1 case of mucoepidermoid carcinoma (MEC) (3.4%).
The mean age and CT perfusion parameters were compared among the three pathological groups (PA, WT, and MT). The mean ages were 62 ± 7.5 years for WT, 52 ± 14.2 years for PA, and 55.2 ± 17.2 years for MT (p = 0.32).
The mean maximum intensity projection (MIP) was 122.7 ± 12.2 in the WT group, 80.5 ± 19.5 in the PA group, and 76.2 ± 27.1 in the MT group (p < 0.001); the mean MIP was significantly higher in the WT group compared to the other two groups (Table 1).
Comparison of Perfusion Parameters
Other CT perfusion parameters were also compared among the three pathological groups. The mean blood flow (BF), blood volume (BV), and peak enhancement were higher in the WT group than in the other groups. The time to peak 2 (TTP2) and TTP were higher in the PA group compared to the MT group (Table 1).
Considering WT and PA as benign tumors versus MTs as malignant, receiver operating characteristic (ROC) curve analysis was used to differentiate benign from malignant lesions. The area under the curve (AUC) for various parameters was calculated (Figure 1). Among all variables, the highest significant AUCs were observed for the standard deviation of MIP (AUC = 0.8), peak enhancement (AUC = 0.81), and a new variable resulting from the multiplication of mean MIP and MIP standard deviation (Table 2).
Further ROC Analysis
Based on the ROC curve, the best cutoff points for these variables were determined with a 95% confidence interval (Table 3).
Using analysis of variance (ANOVA), a significant difference was observed between the mean values of MIP, BF, BV, and peak enhancement in distinguishing WT from PA and MT. Therefore, an additional ROC analysis was performed to differentiate WT from the other pathologies (Figure 2). All parameters showed excellent performance (AUC > 0.93), with the best being the mean MIP with an AUC of 0.99 (p < 0.001), selected as the principal discriminating parameter (Table 4).
Using a cutoff point of 116 for mean MIP (Figure 3), the positive predictive value for diagnosing WT reached 100%. Therefore, lesions with an MIP greater than 116 were considered WT and were excluded from further analysis. After exclusion, 23 patients remained (10 malignant and 13 benign cases).
Under these conditions, a new ROC analysis was performed to differentiate benign from malignant lesions. The best AUCs were obtained for the standard deviation of MIP, mean MIP, TTP, and time to peak 2 (Table 5).
Based on these analyses, the best cutoff points for distinguishing benign from malignant lesions were determined (Table 6).
Analysis of Time-Density Curve Types
Regarding curve types, there were 11 descending curves (37.9%), of which 3 (27.3%) were malignant. Sixteen plateau curves (55.2%) and 2 ascending curves (6.9%) were observed, both of which were benign.
Combining different curve types into a binary variable for distinguishing benign from malignant lesions did not yield significant results. However, considering descending curves as indicative of WT (combining plateau and ascending types together) resulted in statistically significant findings (p = 0.001) with a sensitivity of 88% and specificity of 81%.
Moreover, considering plateau or ascending curves as indicators of PA lesions led to statistically significant results (p = 0.019) with a sensitivity of 91% and specificity of 56%.
Figure 1 shows ROC curves using MIP standard deviation (MIP SD), mean MIP, and peak enhancement for differentiating malignant from benign lesions. Details of this analysis are provided in Table 7.

Discussion
The parotid gland is the largest salivary gland in the human body. Differentiating between benign and malignant parotid lesions under certain conditions is very important:
When surgery is not possible for the patient due to physical conditions, aging, or underlying diseases.
When tumor extension is unclear.
For surgical planning in lesions that have extended into the parapharyngeal space.
In cases of malignant tumors and when facial nerve removal is necessary.
In large or fixed tumors.
When there is suspicion of skin involvement or lymphadenopathy, and during preoperative neck dissection planning.
In this study, the most common parotid tumor was PA, followed by WT, unlike malignant lesions that had different histopathological parameters, consistent with Knopf’s findings.
The success rate of perfusion CT scan was 97.1%, aligning with Dong’s study. Perfusion CT scan of the parotid gland provides an easy way to examine parotid lesions as it is not affected by motion artifacts, dentures, or lower-positioned laryngeal movements, which can cause artifacts in some parotid masses. Patients are advised to remove dentures and avoid swallowing during the perfusion CT scan.
There was a significant statistical difference in the gender distribution between benign and malignant tumors (p-value <0.01), with malignant tumors more common in women, while benign tumors were more frequently observed in men.
Although this parameter was not evaluated in other studies, there was no significant association between benign and malignant parotid tumors with aging (p-value=0.36).
When evaluating TDCs, it was found that patients with WT had a high rate of rapid rise pattern in WR, similar to findings by Dong et al. Ascending TDCs and plateau type 4 curves were more common in PA.
In this study, TDC types 1 and 4 were more common in hypovascular benign masses, while type 2 curves were mostly seen in hypervascular benign masses. Types 3 and 4 were mostly observed in the malignant group. Statistical analysis showed a significant correlation.
Based on Wang’s study, TDC patterns showed significant correlations among the three groups, and BV, BF, and MIP were significantly higher in benign WTs compared to pleomorphic adenomas (PA).
Table 2 — Area under the curve of different variables in the ROC analysis for differentiating malignant from benign pathologies.
Table 3 — Selected cutoff points and their diagnostic indices for differentiating malignant from benign lesions for the best variables.
This is consistent with the results found in Wang’s study.
TDC helps distinguish between hypervascular benign and hypovascular malignant masses.
The presence of a rich capillary network and numerous blood vessels with fragile walls, particularly in WT, could explain this pattern.
Most malignant tumors showed a type 3 curve, and most hypovascular masses showed a type 4 curve; likely due to decreased blood flow and intact vascular walls in benign masses.
Thus, different TDC patterns can reflect microcirculation within parotid tumors and assist in diagnosis.
Figure 2 — ROC curve for MIP in differentiating Warthin tumor (WT) from other pathologies.
Table 4 — Selected cutoff points and diagnostic indices for differentiating Warthin tumors from malignant lesions and pleomorphic adenomas based on average predicted MIP.
Figure 3 — ROC curve using MIP standard deviation (SD), mean MIP by MIP SD, Time to Peak (TTP), and Curve 2 Time for differentiating malignant lesions after excluding lesions with mean MIP of 116.
BF, BV, and MIP parameters showed significant differences (p-value 0.001) between WTs and PAs, which is consistent with Wang’s findings.
Overall, mean BV, BF, and MIP were higher for malignant tumors compared to PA, but without statistically significant correlation.
The presence of multiple necrotic areas in malignant lesions could contribute to reduced perfusion CT parameters.
Thus, MIP, BV, and BF, which reflect tumor angiogenesis, can differentiate the three groups to some extent.
The highest mean BF and BV values were observed in WTs.
No significant difference was found between benign and malignant tumors regarding permeability.
In Dong’s study, BV, BF, and PS were lower in PA than in malignant tumors, opposite to findings with basal cell adenomas, where WT showed higher BV and BF values than malignant tumors.
Due to the diversity of benign parotid tumors and variations in perfusion CT parameters, this method is not ideal for distinguishing benign from malignant tumors solely.
Regarding capillary permeability, PS and TTP showed statistically significant differences between benign and malignant groups, WT group, and PA group.
There was no statistically significant difference in PS among WTs, PAs, and malignant tumors, consistent with Bisdas’s study.
However, Wang’s study reported a positive correlation between benign and malignant tumors regarding PMB, unlike Bisdas’s findings.
This discrepancy might be due to heterogeneity in ROI selection.
Table 5 — Area under the curve of different variables in ROC analysis for differentiating malignant from benign lesions after excluding lesions with MIP ≥116.
Table 6 — Selected cutoff points and their diagnostic indices for differentiating malignant tumors from benign lesions after excluding lesions with MIP ≥116.
Table 7 — Diagnostic indices of curve types for differentiating Warthin tumors from pleomorphic adenomas.
To minimize bias, a solid and homogeneous ROI was selected to avoid necrotic areas, although users may prefer varying ROI shapes and sizes.
TTP showed a statistically significant difference between PA and malignant tumors (p-value=0.016), with TTP being higher in PA.
Given that TTP depends on cardiovascular systems, it is not a suitable factor for perfusion CT analysis based on previous studies.
In a study by Tawfik et al., they suggested using internal carotid artery (ICA), external carotid artery (ECA), and contralateral ICA for head and neck tumor perfusion CT analysis, recommending ICA for standardization.
If the ipsilateral ICA is involved, contralateral ICA is preferred.
BF and BV seem to be more reliable factors compared to PMB and TTP for comparing different parotid tumor types due to discrepancies among various studies.
TDC-peak curve comparison showed statistically significant differences between benign and malignant lesions (p-value=0.008), and between WT and malignant tumors (p=0.001).
The mean parameter for hypovascular benign lesions was 35.9, possibly due to delayed peak time and limited permeability in benign masses compared to malignant lesions.
Other imaging techniques like diffusion-weighted imaging (DWI), intravoxel incoherent motion (IVIM), diffusion kurtosis imaging (DKI), diffusion tensor imaging (DTI), and salivary gland tractography offer additional parameters and can aid in differentiating malignant from benign lesions, as well as post-surgical, post-radiotherapy evaluation, and early detection of Sjögren’s syndrome.
Considering the accessibility of CT and its cost-effectiveness compared to MRI, perfusion CT can be a diagnostic tool for evaluating residual tumors, cervical metastasis, and treatment response in medically compromised patients.
Study limitations include:
Higher radiation dose in perfusion CT compared to conventional CT, although dose reduction may be achieved through dual-energy CT and advanced reconstruction methods.
Slice thickness was limited (3–5 mm) due to the use of a 16-slice CT scanner.

The largest tumor diameter was used for evaluation as parotid glands are superficial.
Detailed classification of malignant tumors and subgroup analysis was not possible due to limited sample size.
In conclusion, perfusion CT parameters can differentiate WT, PA, and malignant tumors (MT).
Modified imaging techniques have been increasingly utilized in strategies for diagnosing parotid masses.
Based on various studies, perfusion CT can differentiate benign from malignant parotid masses.
Perfusion CT is a functional imaging technique assessing tumor vasculature, helping in radiation therapy planning and monitoring response.
CT perfusion parameters can also predict tumor recurrence post-surgery and radiotherapy.
Perfusion CT can assist in selecting patients for surgery and radiotherapy based on unfavorable lesion characteristics often associated with aggressive phenotypes.
Perfusion CT may differentiate reactive lymph nodes from nodal metastasis and identify tumor staging.
Overall, using perfusion CT in head and neck tumors, including parotid tumors, may enhance diagnosis and treatment.
The authors declare no conflicts of interest.
Many specialists are involved in the field of parotid tumor surgery, but not all have acquired substantial experience and expertise. One of the most skilled and highly specialized surgeons is Dr. Rahmati, an otolaryngologist (ENT specialist), who has achieved significant success in head and neck surgeries. This accomplished physician has also gained considerable expertise and experience in the field of rhinoplasty and various nasal surgeries.